Summer Lesson Building (Geometry: Distance and Midpoint)

One of the first lessons this coming year in Geometry will be a “review” of distance and midpoint. I’ve spent the last couple of hours trying to figure out the best way to conceptually work with both of these topics and still keep the lesson in the neighborhood of 50 minutes. I’m stuck somewhere between treating this as a review of material I know my students have seen in the past and going full-on inquiry based learning. I’m leaning towards expecting them to need a reminder about from where distance and midpoint formulas come. I am using this lesson to create situations where there is a need for distance and midpoint.

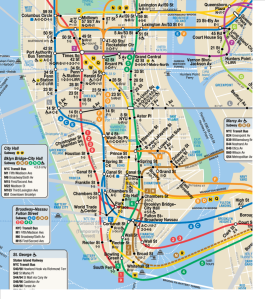
I need to make sure I have my students focus on distance and midpoint on the coordinate plane. To me, the first step is create a need for the coordinate plane. I’ll open with lesson with a subway map of New York City:
1.6 Distance and Midpoint_2

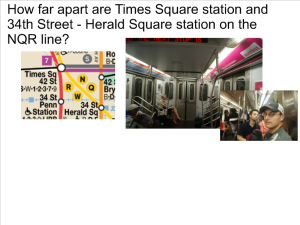
Then, I’ll focus my students to a question:
1.6 Distance and Midpoint_3

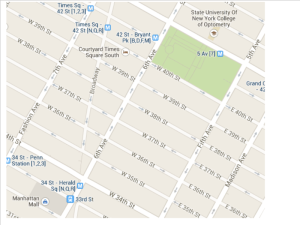
I want them to guess. I want an argument based on what they think they know. I want them to say “it looks like…” and “what’s the scale?” Then, I hope someone finally asks for a way to determine the scaling (I’ll bet they won’t use the term “scale” but whatever works).
1.6 Distance and Midpoint_4
Now they can use the length of a block as the unit of measure. But the streets and avenues aren’t equally spaced! I guess they’ll have to come up with a conversion! I expect some students to remember distance, or that there’s a formula for it. That’s not the purpose of the map. I want them to see how much easier it is to estimate with a grid. Now we have a reason for the coordinate plane!

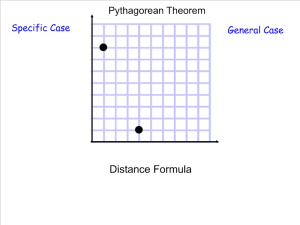
So we’ll start working on a distance formula:
1.6 Distance and Midpoint_5
We’ll work with the Pythagorean Theorem, figure out the process, add in the general case, and derive the distance formula. Then we’ll practice in a non-contextualized situation:
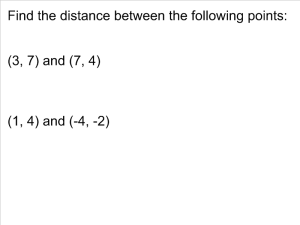
1.6 Distance and Midpoint_6

1.6 Distance and Midpoint_7

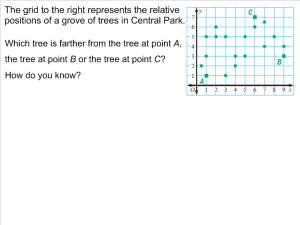
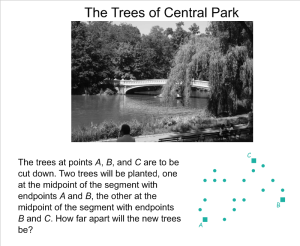
Then I’ll give them a “real life” situation that requires them to ask for a coordinate plane:
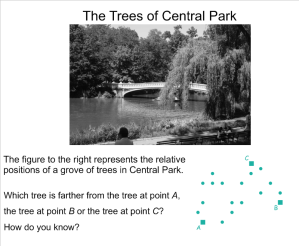
1.6 Distance and Midpoint_8
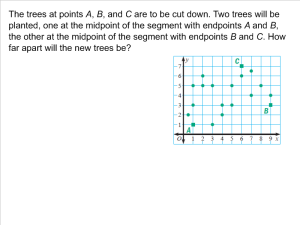
and once they ask:
1.6 Distance and Midpoint_9

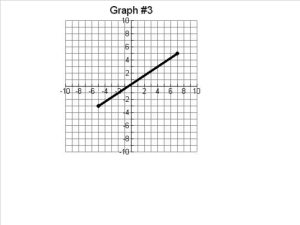
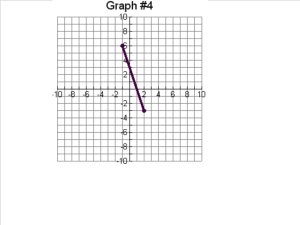
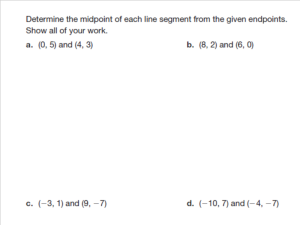
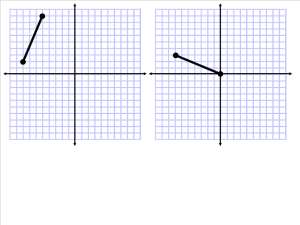
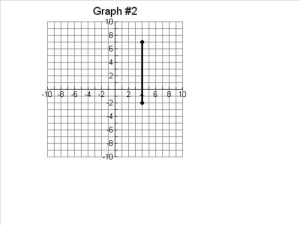
For part two of the lesson, we’ll focus on midpoint. I’ll give my student the following four graphs:
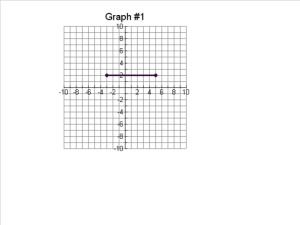
1.6 Distance and Midpoint_10

1.6 Distance and Midpoint_11

1.6 Distance and Midpoint_12

1.6 Distance and Midpoint_13

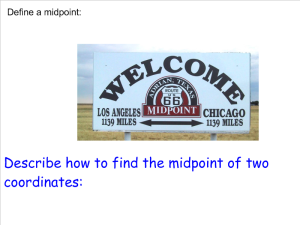
The only direction I’ll give them is to find the midpoint of each of the line segments. Their goal is to define the midpoint for themselves, then come up with some way to find it:

1.6 Distance and Midpoint_14

We’ll come up with a class consensus for a definition and a formula for the midpoint.

Then we’ll practice:
1.6 Distance and Midpoint_15

1.6 Distance and Midpoint_16

1.6 Distance and Midpoint_17

Overall, I’m not thrilled with this lesson. I think it will do its job, but I’ll keep searching for a better approach. Also, I’m expecting this lesson to last more than one class period. I really don’t see how I can expect to finish this in less than a day and half without losing the student centered approach. Thought?
Summer Lesson Building (Geometry: Surface Area and Volume Ratios)

I’ve been looking for a way to bring up surface area and volume ratios that isn’t a forced “here’s some non-contextual geometric solids to calculate arbitrary values for linear, area and volume measurements.” After looking through some resources and reading some blogs, I found an idea for introducing them: Orbeez!

If you don’t know what Orbeez are, go here: http://www.orbeezone.com/

I’m going to have my students explore their claim…or rather figure out what their claim is:
Orbeez Surface Area to Volume Ratios_1

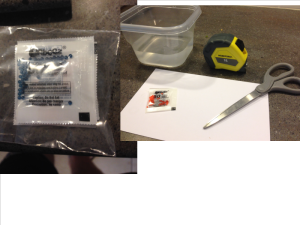
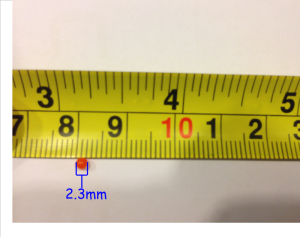
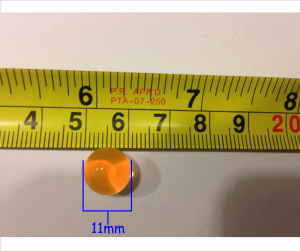
They’ll have to figure out what’s blacked out. They’ll ask for some measurements, so I had the chance to buy some Orbeez and play with them!

Orbeez Surface Area to Volume Ratios_2

Orbeez Surface Area to Volume Ratios_3

Orbeez Surface Area to Volume Ratios_4

Orbeez’s claim is about how much the volume grows. I wanted to leave that little tidbit of information missing. My hope is that the students start with the diameter grows approximately 4.8 times larger. Next, I hope they go to where the surface area grows approximately 23 times larger. Finally, I hope they figure out that the volume grows by a factor of around 109. We’ll come to some conclusion of a class as to which one is the best to help sell the product and they’ll see:

Orbeez Surface Area to Volume Ratios_5

This isn’t meant to be stand alone as a surface area and volume ratio lesson. It’s going to give us a starting point to look at the relationship between the values (the 4.8, 23 and 109). Hopefully they’ll infer what the relationship is and we’ll finish the lesson.

Summer Lesson Building (Algebra II Honors: Extrema of Polynomial Functions)

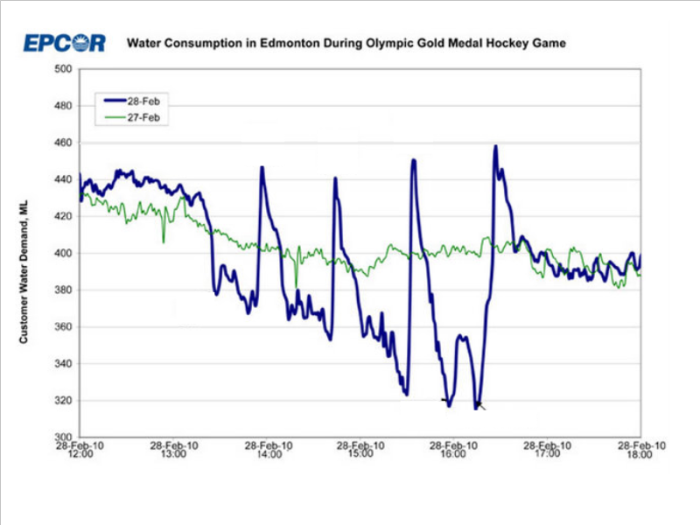
A couple of months ago, I ran across a lecture that featured this graph:

Gobal and Local Extrema Lesson_1

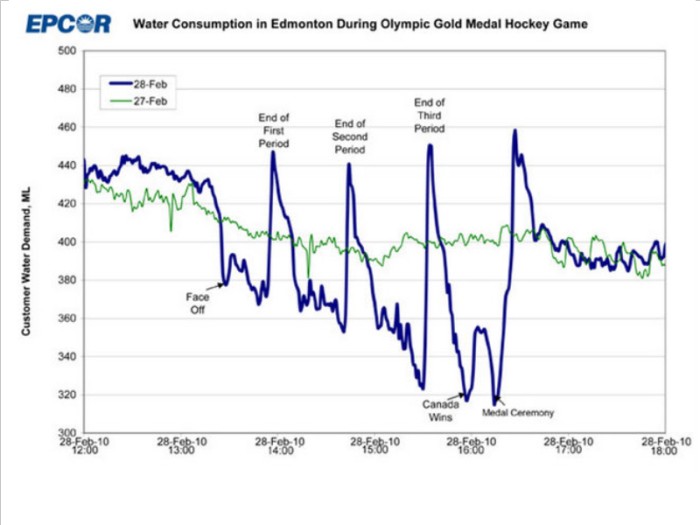
This graph shows the water consumption on February 28, 2014 by the city of Edmonton during the gold medal men’s hockey game during the last Winter Olympics (in which Canada defeated Sweden 3-0). My students will try to answer one simple question: What can this graph tell us?
I’m expecting that the conversation will drift toward the fact that there are some weird peaks and valleys. Then, we can figure out what those peaks and valleys are.

In case you’re curious:

Gobal and Local Extrema Lesson_2

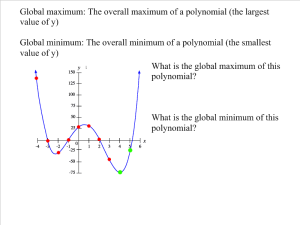
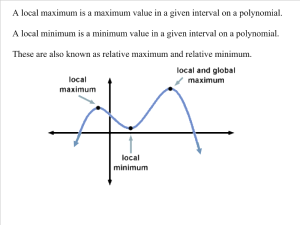
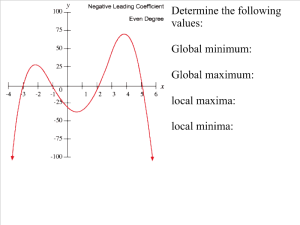
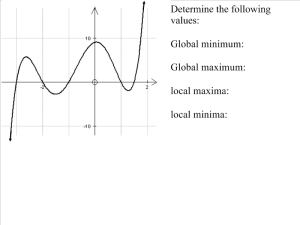
My hope is that this conversation can create a need for the importance of local and global maxima and minima. We’ll do the typical defining and practicing:

Gobal and Local Extrema Lesson_3

Gobal and Local Extrema Lesson_4

Gobal and Local Extrema Lesson_5

Gobal and Local Extrema Lesson_6

My hope is that the students get a sense of an example where maxima and minima mean something.

Summer Lesson Building (Geometry: Naming Basic Geometric Figures)

So, I put in for a presentation at the Florida Lab School Drive-in Conference and managed to get accepted. My session title is “Creating Need in the Mathematics Classroom” and is centered on an approach I started to focus on last year in my curriculum. I’ll give more details as I really dig into making my presentation. But in order to help my presentation, I need to start building lessons that lend themselves to helping create my presentation. So here we go:

Although it’s technically not a standard, the first topic we’ll discuss in geometry is how to name basic geometric figures. My students need to be proficient in naming points, lines, rays, line segments, angles, etc.; otherwise, they won’t succeed in Geometry.

So I figure there’s two options in how to present this to students.
Option 1: I can tell my students how to name figures. If they ask my why, I’ll tell them because I said so…or someone said so some time ago. I can hear my students falling asleep already. I can hear them saying “who cares?” I can see them struggling to remember how to name geometric figures. I need a better option.

Option 2: I can create a need for naming geometric figures. Here’s how:

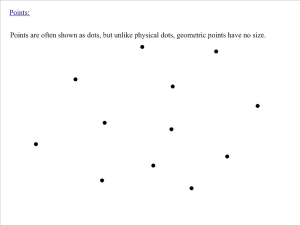
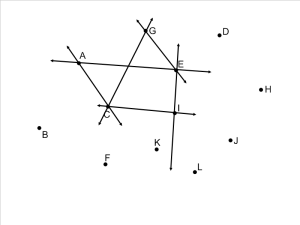
We’ll start with this slide:
1.1 The Building Blocks of Geometry_3

I’ll ask one student to pick a point and not tell anyone which one they chose. I’ll then ask them to describe which point they chose to someone else on the other side of the room without using any physical cues. My hope is that this will be a giant pain in the rear for my students.

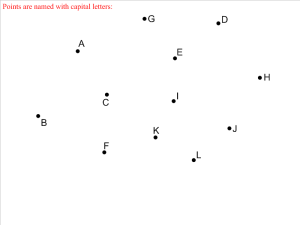
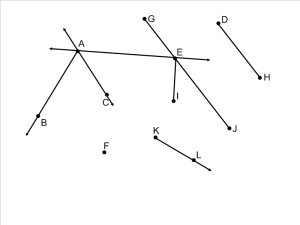
Then I’ll show them this slide:
1.1 The Building Blocks of Geometry_4

I’ll ask them to repeat the process. I’m betting they’ll have an easier time.

To really emphasize my point (and to practice the whole writing and communicating thing), I’m going to give them a partner project:

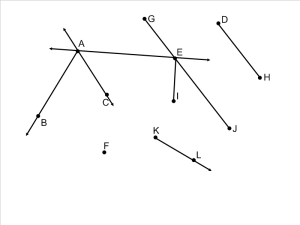
One person in the partnership will get this:
1.1 The Building Blocks of Geometry_7

They’ll get three minutes to write a set of instructions to have their partner recreate this picture. Once the instructions are made, their partner will have to use this:
1.1 The Building Blocks of Geometry_4
and recreate the picture.

My hope is that they’ll fail miserably, and this activity will create a need for them to find a better way to quickly and efficiently name geometric figures.

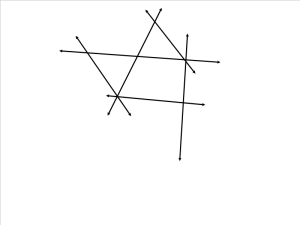
We’ll start with lines. I’ll ask a student to pick a line:
1.1 The Building Blocks of Geometry_8
Then, they’ll have to describe which one they picked to a fellow student.
1.1 The Building Blocks of Geometry_9
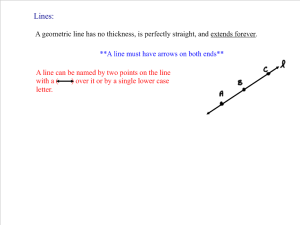
They’ll decide this is easier. I’ve purposely set this up to where they’ll need two points to describe which line they chose. Once they’ve made this decision (and only when they’ve decided how to name the line), I’ll help them create that definition:

1.1 The Building Blocks of Geometry_10

By now, I think my students will have gotten the point. We’ll discuss how to extend this idea to line segments and rays. To finish, we’ll go back to this activity:

1.1 The Building Blocks of Geometry_13

I’ll have one student write a set of instructions and their partner will recreate the picture.

My hope is that this lesson design will create a need for naming geometric figures. The way we name figures is not arbitrary, and hopefully my students will discover that.

Summer Lesson Building (Algebra II Honors: An Introduction to Functions)

I know that they probably don’t need an “introduction” to functions. They’ve seen functions and they’ll be able to tell me all about the vertical line test (even if they don’t know why they use it). I see this lesson as a review of function notation, as well as a way for me to set the table for the relatively formal notation and understanding of functions they’ll use throughout the year. I will implement this lesson on the second day of class.

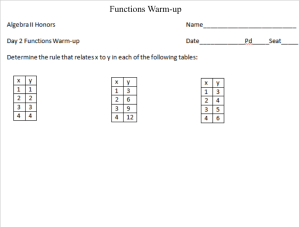
Their warm up will start here:

Intro to Functions lesson_1

We’ll start the conversation about finding a “rule” that related the x-value to the y-value. I want them to start to look at these relations and see patterns (eventually they’ll recognize the types of patterns…e.g. linear, quadratic, etc.).

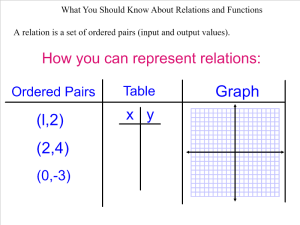
We’ll discuss the three big types of ways we’ll look at relations…coordinates, tables and graphs. I’ve found that my students don’t see them as three ways to represent the same thing. This will be the first time we have a chat about how an equation, a graph, a table, and coordinates all show the same thing; that the graph of an equation is not “the answer” they’re trying to get to match the back of the book.

Intro to Functions lesson_2

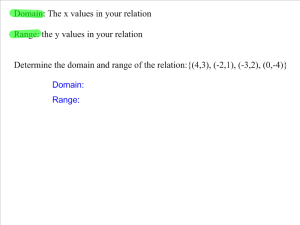
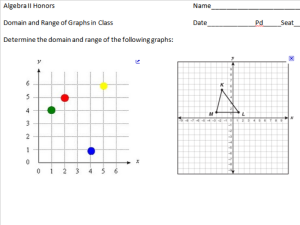
We’ll then discuss the domain and range of a relation. They’ll be used to the idea, but I expect them to struggle with any representation that isn’t a set of coordinates:

Intro to Functions lesson_3

Intro to Functions lesson_4

Then comes the time to discuss a function. I found a video a few years ago that some group of teachers made and posted to youtube. It is by far the most entertaining input/output video I’ve ever seen:

I didn’t make that video, but I thoroughly enjoy watching my students experience it in class!

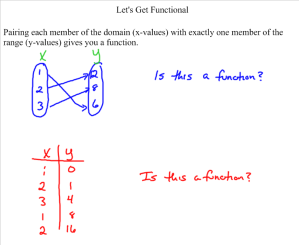
Next, we’ll define a function and work with that definition:

Intro to Functions lesson_6

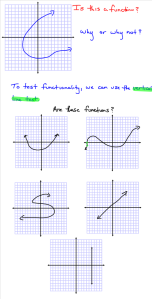
We’ll refer back to the idea of domain and range so that my students can decide that a vertical line test will work on a graph to determine functionality. I’m going to post the slide that I currently have for this, but looking at it now, I’m going to change it.

Intro to Functions lesson_7

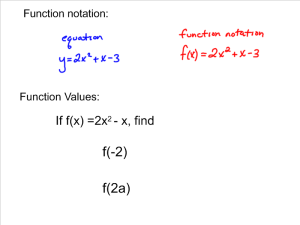
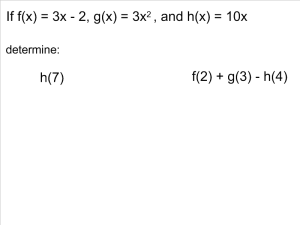
Then we’ll discuss function notation:

Intro to Functions lesson_8

Intro to Functions lesson_9

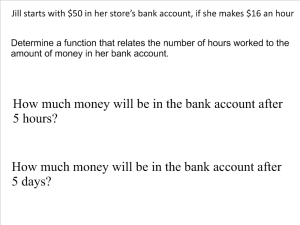
And finally, we’ll bring it all together with them creating their own function:

Intro to Functions lesson_10

This last slide is the most important. I will emphasize with them that a function relates two variables. The input gives you one value for an output. The number of hours gives you an amount in the bank account. My goodness, that’s such an important idea. An input gives you an output. We’ll be using that all year!

Summer Lesson Building (Algebra II Honors: Solving One Variable Equations)

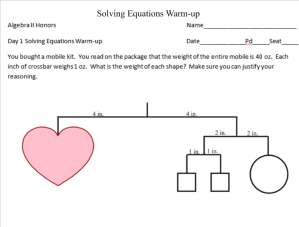
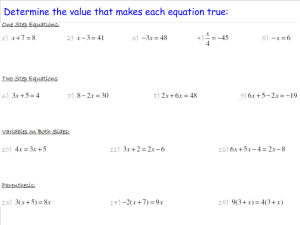
The first day of Algebra II is a chance to get my students up and running with something they know how to do, but may not remember the meaning behind it. They’ll walk in the door to the following warm-up:

Solving Equations Lesson_1

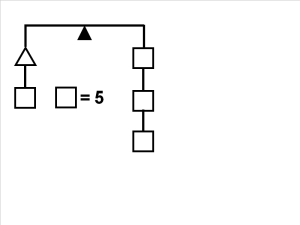
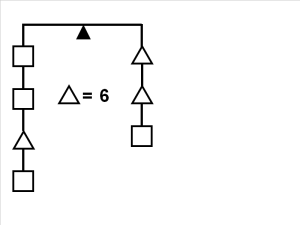
For the first ten minutes or so of class, we’ll focus on the idea of the solution is the value that balances each mobile:

Solving Equations Lesson_2

Solving Equations Lesson_3

I expect my students to bring equations into this with some sort of notation (whether it’s using squares and triangles, or variables). We’ll discuss the connection between the solution to an equation and it being the value that balances the two sides.

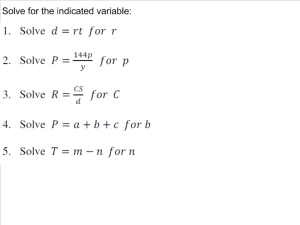
Next, we’ll practice solving one variable equations:

Solving Equations Lesson_4

Solving Equations Lesson_5

My students will solve them and explain the process. We’ll start the process of talking about inverses during the discussion about “the reverse order of operations.”

This lesson is meant to be a review of something they’re already comfortable with and a nice way to begin the year. The second half or so of class will focus on procedures and expectations.

Thoughts?

Summer Lesson Building (AP Statistics: Graphical Displays of Data)

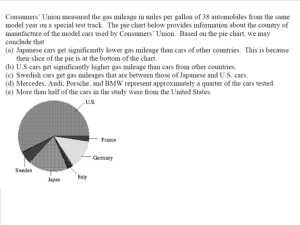
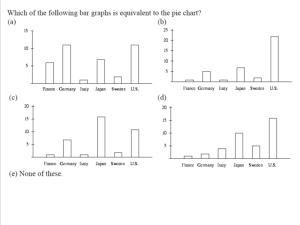
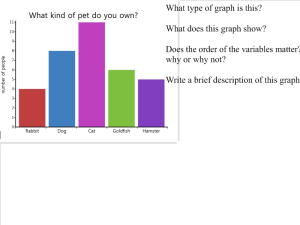
The first major unit in AP Statistics is all about summarizing data. To begin our summarizing one variable data, we’ll begin with pictures…using graphs to help us summarize data. The first day of graphical displays of data focuses on the difference between how to create graphs for categorical and quantitative data. We’ll explore bar graphs, pie charts, dotplots and stemplots. We’re leaving histograms for the next day.

The class will begin with a warm up focused on the question:
1.1 Bar Graphs, Dot Plots, Stem Plots_1

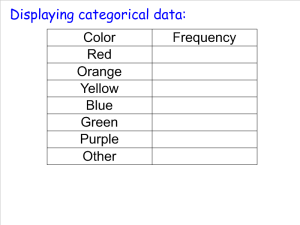
There will be directions of what the only possible choices are (set color categories) and I’ll ask them to write their response on a sticky note. My students will then place their response on the white board. I’ll ask them to summarize the data we just collected. Hopefully, the conversation will end up at showing frequencies for each category.
1.1 Bar Graphs, Dot Plots, Stem Plots_2

Next we’ll want to create a graphical representation:

1.1 Bar Graphs, Dot Plots, Stem Plots_3

1.1 Bar Graphs, Dot Plots, Stem Plots_4

We’ll use excel to create a pie chart and this will be the only time that we ever create a pie chart together. The only expectations they have involving creating a graph for categorical data is: 1) They can create a bar graph, 2) they can interpret any graph they’re given.

Then we’ll check for understanding:
1.1 Bar Graphs, Dot Plots, Stem Plots_5

1.1 Bar Graphs, Dot Plots, Stem Plots_6

1.1 Bar Graphs, Dot Plots, Stem Plots_7

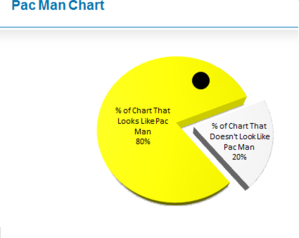
And I’ll try to be entertaining (or I’ll at least humor myself):
1.1 Bar Graphs, Dot Plots, Stem Plots_8

1.1 Bar Graphs, Dot Plots, Stem Plots_9

1.1 Bar Graphs, Dot Plots, Stem Plots_10

Then the focus will change to quantitative data. I’ll pull out a funsized bag of M&Ms and ask them to tell me how many are in the package. They’ll say they don’t know…I’ll ask them how we could figure it out…eventually, they’ll tell me to open and count…so we will. Then, I’ll take out another funsized bag of M&Ms and ask the same question. They’ll say the same as the last bag…I’ll ask if they’ll bet money on it…they’ll say no…we’ll discuss variability. Then we’ll explore the variability. Each student will get their own package and count the M&Ms and they’ll organize the data:

1.1 Bar Graphs, Dot Plots, Stem Plots_11

I have to be careful not to lead too much. I want them to decide that a dotplot makes sense to organize their data. After they collect their data, I’ll take out one more funsized package of M&Ms and ask how many are in it. They’ll eventually decide that the center of their distribution is their best guess, but the number could be in the range that’s shown on the dotplot. We’ll lay the foundation to make the values for the mean and standard deviation important!!

We’ll practice a bit:
1.1 Bar Graphs, Dot Plots, Stem Plots_12

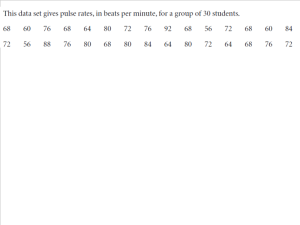
I’ll give them another “practice” set of data:

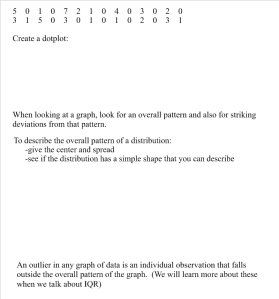
1.1 Bar Graphs, Dot Plots, Stem Plots_13

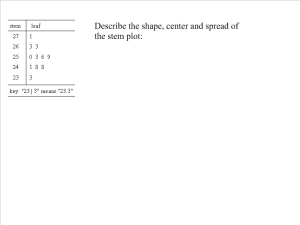
The idea behind this set of data is that a dotplot won’t help. The data is too spread out. This will create a need for a new type of graph: a stemplot! We’ll discuss stemplots and they’ll practice.
1.1 Bar Graphs, Dot Plots, Stem Plots_14

This is a lot to get done in a 50 minute class period. I’m going to need to see if and where I can streamline some of this. Any thoughts?

Summer Lesson Building (AP Statistics Defining Variables)

With EOC scores out and AP scores about to go live, it’s time to start building next year’s curriculum. I am moving forward on the assumption that I’ll be teaching the same preps next year (as dangerous as that may be). I’m posting these lesson plan ideas with the hope to open conversation and develop better lessons. Feel free to post any thoughts you may have:

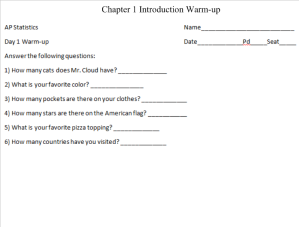
The first day of school in AP Statistics will begin with this warm-up:
Chapter 1 Introduction_1

I’ve worked with this set-up before with a group of teachers at the Summer Statistics Institute. This question really led to some good conversation:

Chapter 1 Introduction_2

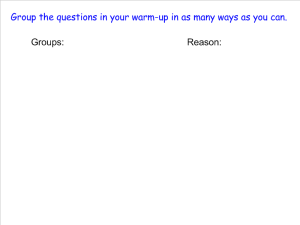
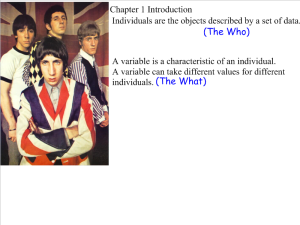
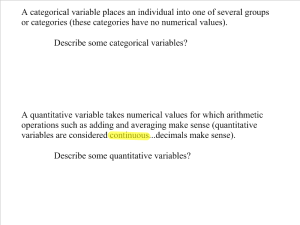
My hope is that the group can come to a definition of what a statistical question is compared to a mathematical question. Somewhere in that conversation, we’ll define what a variable is and the types of variables (categorical vs. quantitative).

Chapter 1 Introduction_3

Chapter 1 Introduction_4

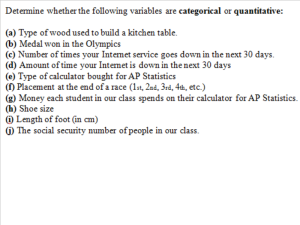
This lesson is built around a MAFS 6th grade standard. I don’t know that my students have ever had a conversation like this one. I’m going to try to do a better job this year of not assuming that my students really understand the difference between mathematics and statistics, and what better way than begin day 1 with that conversation. There will be some practice:

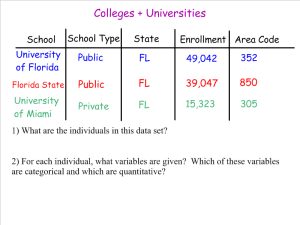
Chapter 1 Introduction_5

Chapter 1 Introduction_6

Then, the rest of the period will be about routines and expectations for the school year.

Any thoughts?