Summer Lesson Planning: The Galton Board

Well, I’ve started planning some activities/interesting questions to add to my AP Stats curriculum.  I’ve noticed that my teaching lacks the ability to have my students see the normal distribution happen naturally.  Every year, I’m forced to have my students take my word that the normal distribution is…well…really real.

So, seeing that I’ve had some time to develop some lesson ideas (which is code for I get to watch The Price is Right)…and I remember seeing this:

Note: I’m going to come up with some binomial distribution lesson from this video too

I’ve taught workshops for teachers that involve probability, the normal distribution and the mention of galton boards (go ahead and click it…I made the hyperlink).  But the mention of the galton board was just that…a mention.  I wanted to have my students experience it!

I scoured the internet for an inexpensive (it is the summer afterall) galton board.  No such luck.  I tried to find a video on the internet that I could pull data from.  Even less luck.  So I made my own videos.

This is meant to be a ten minute #threeactmath inspired (gotta love Dan Meyer) activity.

It starts with:

Then, after some class discussion, they’ll find out there a total of 500 balls dropped.  Their job is to predict what will happen.

2.2 The Normal Distribution_3

The hope is to start making connections between the shape of the distribution and probability.  There are more ways to a middle slot than an end slot; meaning that there should be more in the middle.  The distribution should be symmetric (and we’ll discuss what would make it not symmetric).  Basically, building the idea of unimodal and symmetric for a normal distribution.

Then they’ll finally see the answer:

More than likely, my students won’t be correct in their guesses, but the conversation is really the important part.  I’m hoping to bring this back when we talk about binomial distributions/probability as well.  The more I write about this, the more I realize there’s some really rich discussion can come from this.

Please feel free to comment and discuss any thoughts you have.
First Homework Assignment

Alright.  We’re back online.  I know it’s been a while.

This year, it’s time to really revamp Algebra II.  I have to do a better job of advocating for thinking mathematically and persevering through problems.  So we’re going to start day one.

Here’s their homework assignment:

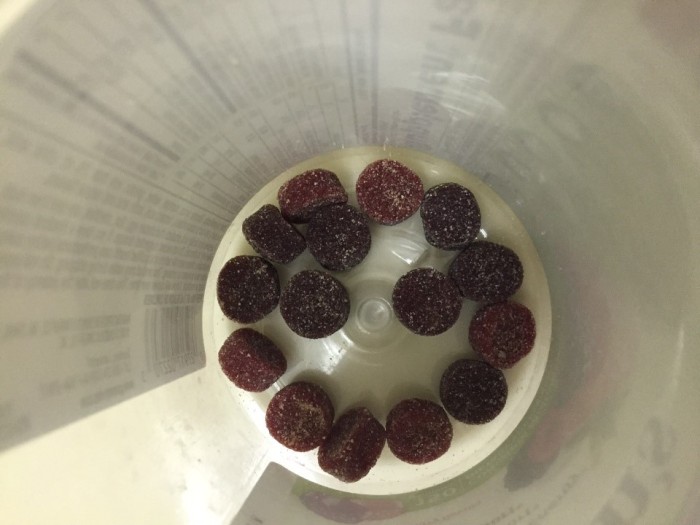
Mr. Cloud tries to be a healthy person and takes multi-vitamins daily.  He absolutely LOVES the gummy ones!

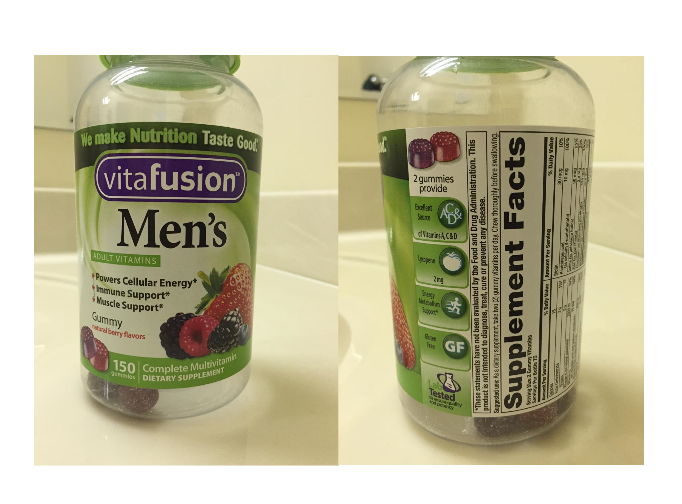
Here they are:

Bottle.png

As he was finishing this bottle, Mr. Cloud thinks he was ripped off (he didn’t get what he paid for).  Here’s what he saw:

Inside

Circle One:

Did Mr. Cloud get ripped off?     YES         NO         Can’t Tell

Provide a well written justification for your answer:


So that’s it.  That’s the whole assignment.  And I’m going to leave this right here.  Feel free to comment and argue your point!


Day 5: A Quiz, Special Right Triangles and Cups

Day five.  The first Friday.  My students were tired.  I was tired.  The first week was successful; at least, I felt that it was.
AP Statistics: The first week culminated in a quiz.  I did learn that we need to work on communication through writing.  I feel like they have a good grasp on what we’re learning, but they’re having trouble communicating it.

Precalculus:

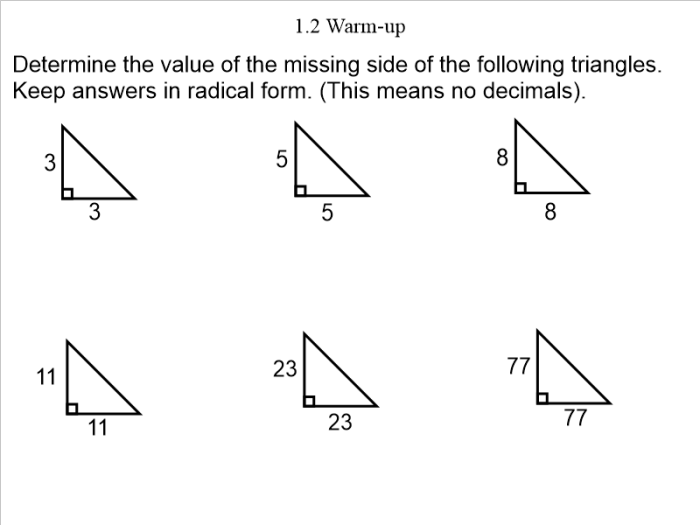
In precalculus, today’s lesson is to connect calculating trigonometric function values with their knowledge of special right triangles.  I was a bit concerned about their memory of special right triangles, so their warm up had them working with 45-45-90 triangles:

1.2 Trig Functions and Special Right Triangles_1

My hope was that they’d quickly realize the pattern that the length of the hypotenuse is the leg times the square root of two.  They did, and they had the “oh yeah” moment.  I regret not proving this fact to them.  I need to make sure when we’re coming up with rules and theorems that I’m more formal about it; those students who go on to do higher mathematics need that exposure.
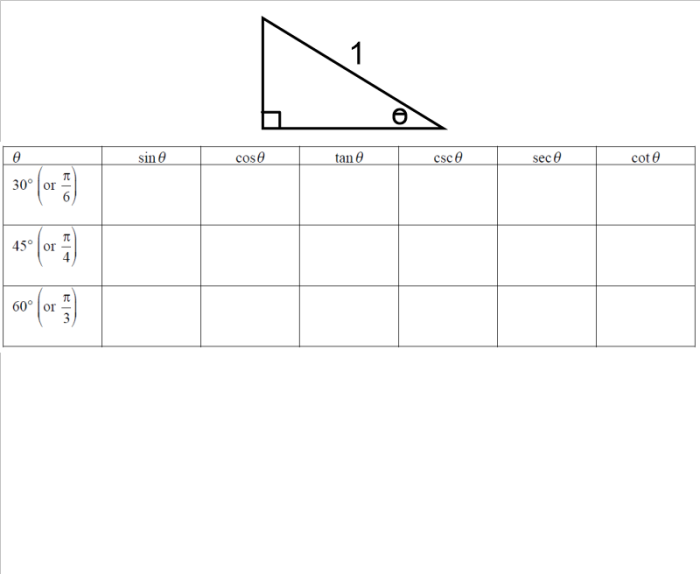
After spending time with 30-60-90 triangles, the end of class culminated in:

1.2 Trig Functions and Special Right Triangles_6

The part my students are struggling with the most is the simplification of fractions with square roots.  I’m trying to convince them that they’ll become comfortable with them; they just need to be willing to practice.
Algebra II Honors:

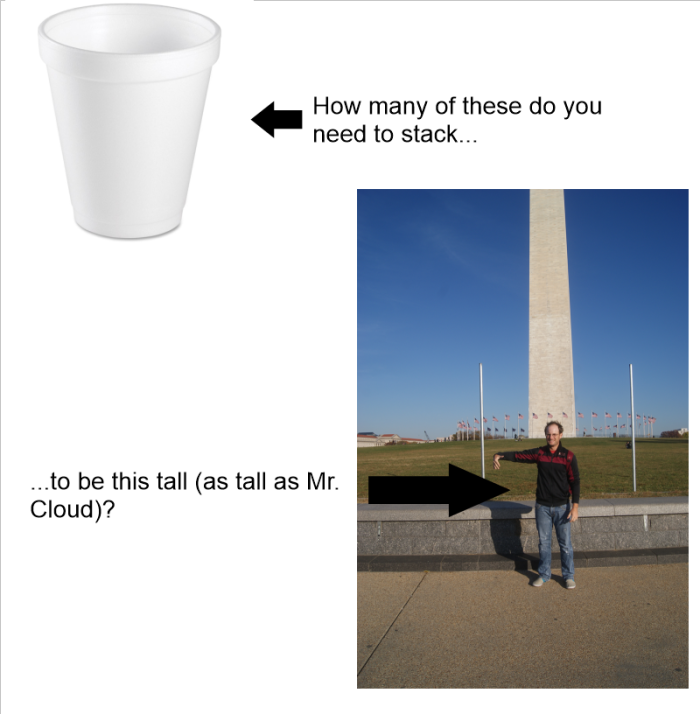
I’m a bit concerned that my students don’t know what makes a linear function linear.  We took a day out to discover what linear really means.  I’ve told them that as we look at functions, we’re going to study them in three ways: a graph, a set of coordinates, and an equation.  They knew what makes a graph of a function linear, but not the other two representations.  So we explored:

1.3 Classifying Patterns_1

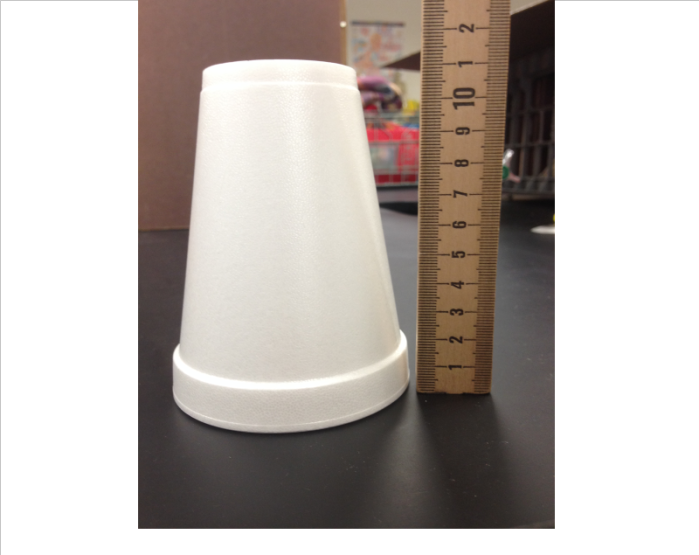
Each pair of students received three cups and a ruler.  From that information, they needed to make their estimation.

In case you want to play along:

1.3 Classifying Patterns_2

Most groups realized that there is a constant growth in height caused by the lip of the cup.  From that measurement (which is really 1.5ish centimeters…even though it looks like 2 centimeters in the picture) they extrapolated their guesses.

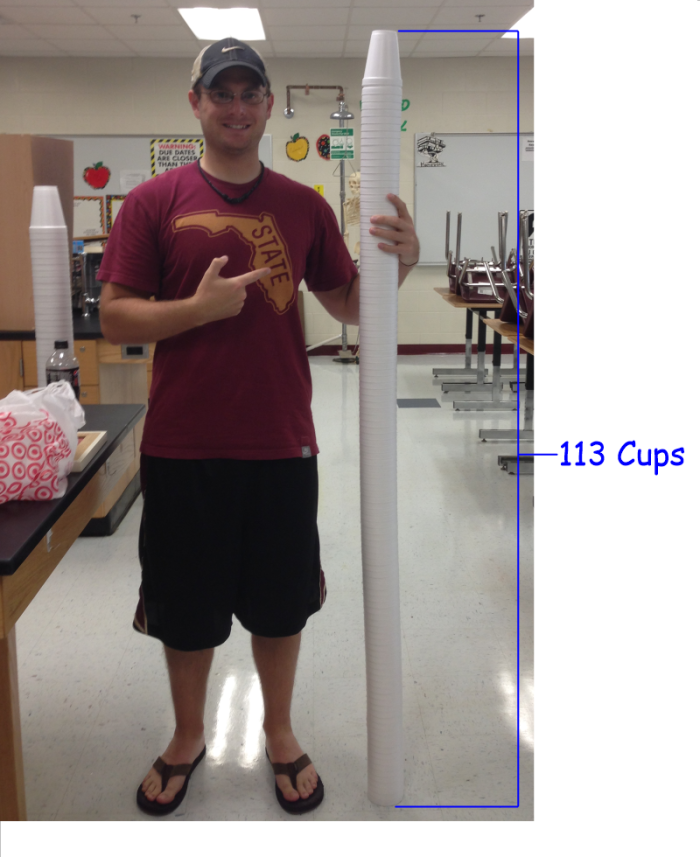
1.3 Classifying Patterns_4

A few groups got to 116 cups.  Most were within 10 cups.

From their realization that the height of the stack grows at a constant rate in relation to the number of cups, we had the discussion of what linear means.  Ideas about rate of change, y-intercepts, and functions were all discussed.  The hope was this concrete example would let them see that constant change (slope) is what makes a function linear.  This led to other discussion and playing with geogebra.  Fun was had by all (or at least me)!

Day 4: More Function Transformations, Percentiles, and a Golf Match

I know this is many days late, but this post refers to last Thursday (eep).  I’m going to do my best to get caught up this week.  Day 4 was a bit less eventful than most.  We spent a lot of time defining and transforming.

Precalculus:  This class was definitely the least eventful of the day.  I had to leave school early to go to a golf match.  So, we debriefed homework, and then I went on my way (while they did some conversion practice).  Unfortunately, this will happen more than I’d hope for this nine weeks.

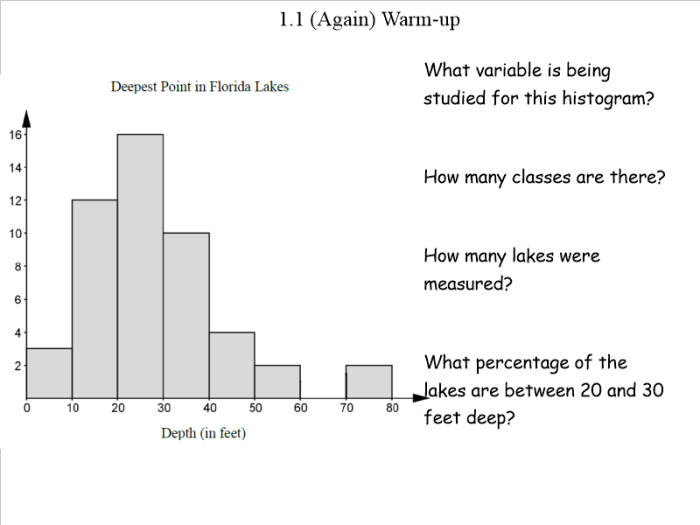
AP Statistics:  We started the class with a warm-up that I modified from FSU’s Learning Systems Institute MFAS project (I think…I mean…I’m pretty sure).

1.1 Frequencies, Percentiles, and Ogives_1

We used this set of questions to emphasize details and clarity in their writing.  Defining the variable as clearly as possible, how they calculated certain values, etc.

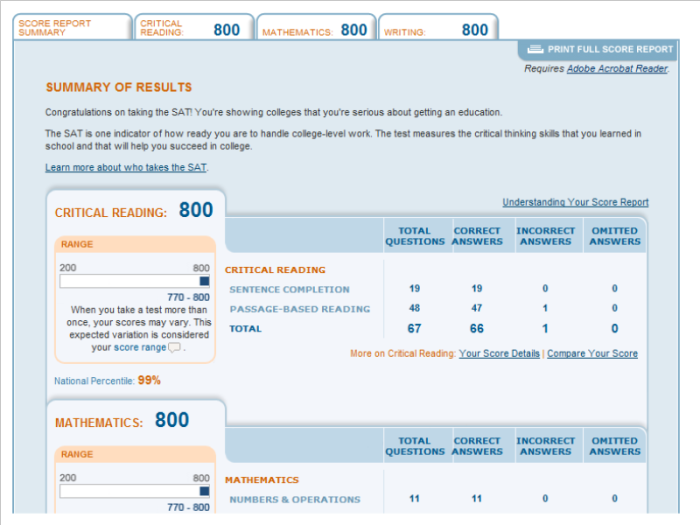
The rest of class discuss percentiles and their usage.  We started the conversation with the least imaginative example I could think of:

1.1 Frequencies, Percentiles, and Ogives_6

Then came the hard-hitting question: “What does the national percentile represent?”

We spent the rest of the class calculating frequencies, relative frequencies (percents), and cumulative relative frequencies (percentiles).  Then we learned how to create and interpret ogives (they show percentiles versus variable values).  Nothing too spectacular, but necessary.

Algebra II:

We continued our conversation about transformations of functions.

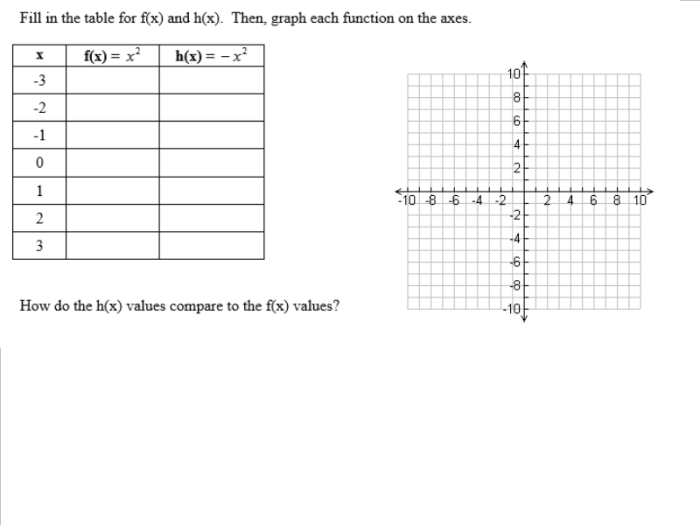
1.2 Transforming Functions Day 2_2

This is the style of question I want them to be able to answer.  General trends for general functions.  Not memorizing rules, but knowing the 3 affects the input and the 2 affects the output.  Understanding that changing inputs affects the x-direction and changing the outputs affects the y-direction.  We’re really going to develop function ideas throughout the course of the year.

The rest of the activity was:

1.2 Transforming Functions Day 2_4 1.2 Transforming Functions Day 2_5 1.2 Transforming Functions Day 2_6 1.2 Transforming Functions Day 2_7

I could hear them starting to hypothesize what would happen (and justify their reasoning).  They’re still a bit afraid to be wrong.  I’m trying to convince them that they learn more from being wrong than being right all of the time, but they’re still a bit apprehensive.  It’s getting better though; we’ll stick with it.

Day 3: Histograms, Trigonometric Functions, and Function Transformations

Three days into the school year, my students and I are still getting used to each other.  Some classes have figured out that I prefer dialogue between teacher, student and other students.  Other classes have not started to trust that idea.  I’ll continue to encourage them to work together.

AP Statistics:

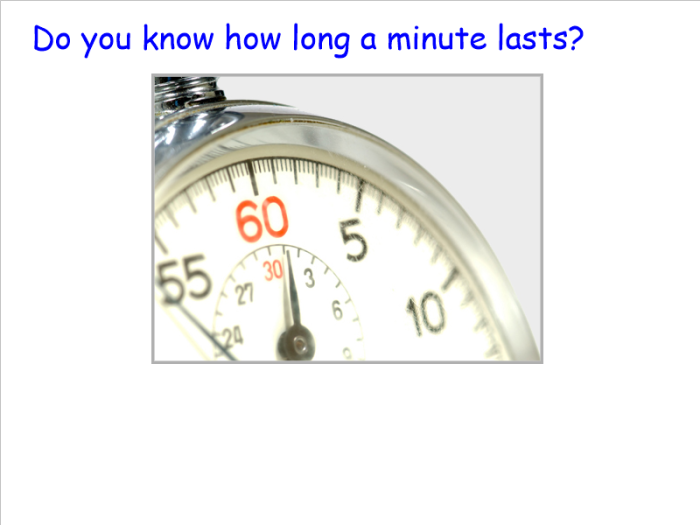
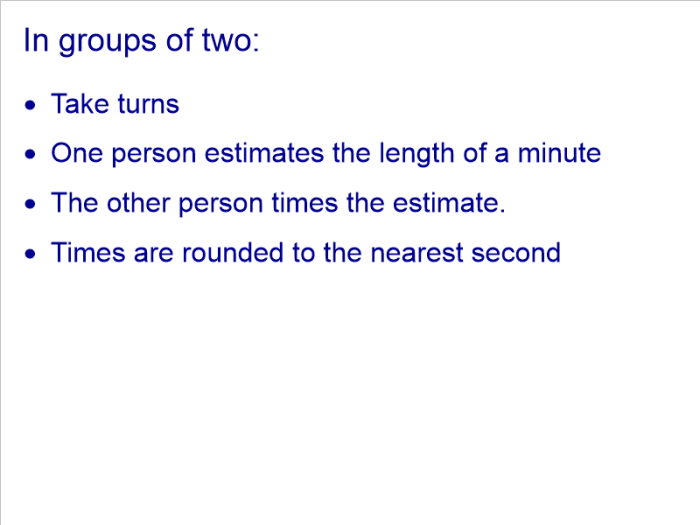
Today’s goal was to appropriately display quantitative data.  Most of the conversation focused on making histograms, stemplots and dotplots.  We did collect some interesting data though:

1.1 Histograms_3 1.1 Histograms_4

All of the data points were between 52 and 70 seconds.  Not too shabby.  Today was also the first day of AP Exam prep (even though they didn’t realize it).  Once we listed all 20 of the times from the class, I stepped back and said “now describe the data.” They had to work together to get all of the aspects they needed to describe: shape, center, spread, outliers/gaps/clusters.  They had some great conversations too!

Precalculus:

We started class connecting what they learned about converting from degrees to radians and how to calculate arc length (with angles in both degrees and radians).  Man, the connections that were made and the speed at which they picked it up was impressive.  I’m really excited about their potential.

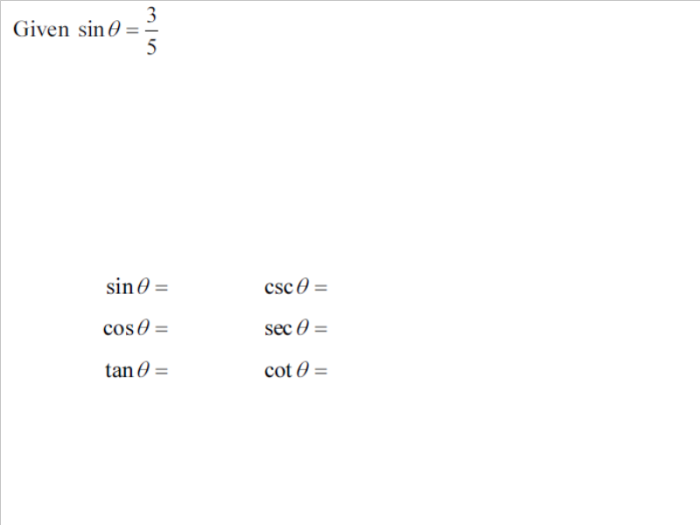
Speaking of their quickness, we defined three new trig functions they hadn’t worked with before: secant, cosecant and tangent.  Rather than drill methods to solving problems, I threw this with them without any hints:

1.2 Trigonometric Functions Lesson_5

The ease in which they figured out to draw a right triangle, and use the Pythagorean Theorem was great!  I figured this would challenge them at first, but I was definitely wrong.  I definitely need to step up my game.

Algebra II:

We’ve begun to go deep into the world of functions.  I’m noticing that some of my students are struggling to see the big picture.  In today’s activity the focus was supposed to be on how changes in a function affects its graph:

1.2 Transforming Functions Day 1_2 1.2 Transforming Functions Day 1_3 1.2 Transforming Functions Day 1_4 1.2 Transforming Functions Day 1_5

We ended up so bogged down in the details of the order of operations and plotting points that we lost sight of the big picture.  Hopefully their homework tonight can help re-focus them.

Day 2: Displaying Categorical Data, Functions and Radians

It’s Day 2 and I’m tired.  I need to work on my conditioning.  My lessons were a bit dryer than I’d prefer today.  Here are some highlights from today.

AP Statistics:

The goal today was to be able to summarize univariate categorical data (and start the conversation about summarizing quantitative data).  The lesson started with having my students collect some categorical data and telling them organize/graph the outcomes.  Every student chose to make a bar graph.  We discussed features of a bar graph and its advantages over a pie chart.  The most interesting part of the lesson, however, happened with this slide:

1.1 Bar Graphs, Dot Plots, Stem Plots_6

We used remote responders so I could get instant feedback from the class and found that 80% of them missed this question (the answer is E by the way).  After discussion, we came to the consensus that there was a reading issue.  Whether they read too quickly, or not carefully enough, I need to keep an eye on this and help with their critical reading skills.

Algebra II Honors:

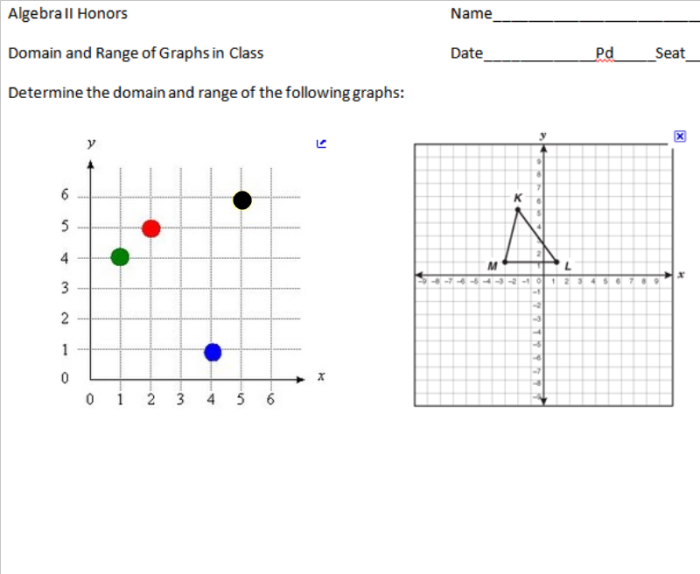
In class today, we had a crash course on everything they should know about functions.  Discussions included domain and range, with proper notation.  Interestingly enough, they did struggle with the domain and range of the triangle here:

1.1 Intro to Functions lesson_4

They wanted to tell me that the triangle had three points.  After quelling that misconception, we realized that we can write domain and range using inequalities.  I’m glad we came across that gap in their knowledge.

After domain and range, we discussed the input/output idea behind a function…and we got to watch one of my favorite educational videos.

The conversation we have during this video is really rich.  The nuggetizer really gets to the input/output idea without an equation.  good stuff.  and it’s entertaining.

Precalculus:

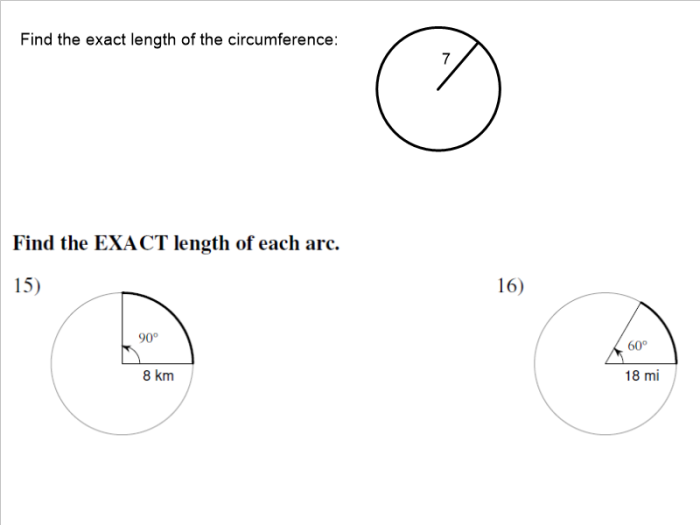
Today we explored radians.  The warm-up allowed them to review circumference and arc length.

1.1 Radians and Arc Length_1

I’m finding they’re a little rusty/apprehensive about fractions.  I need to make sure we get better quickly.

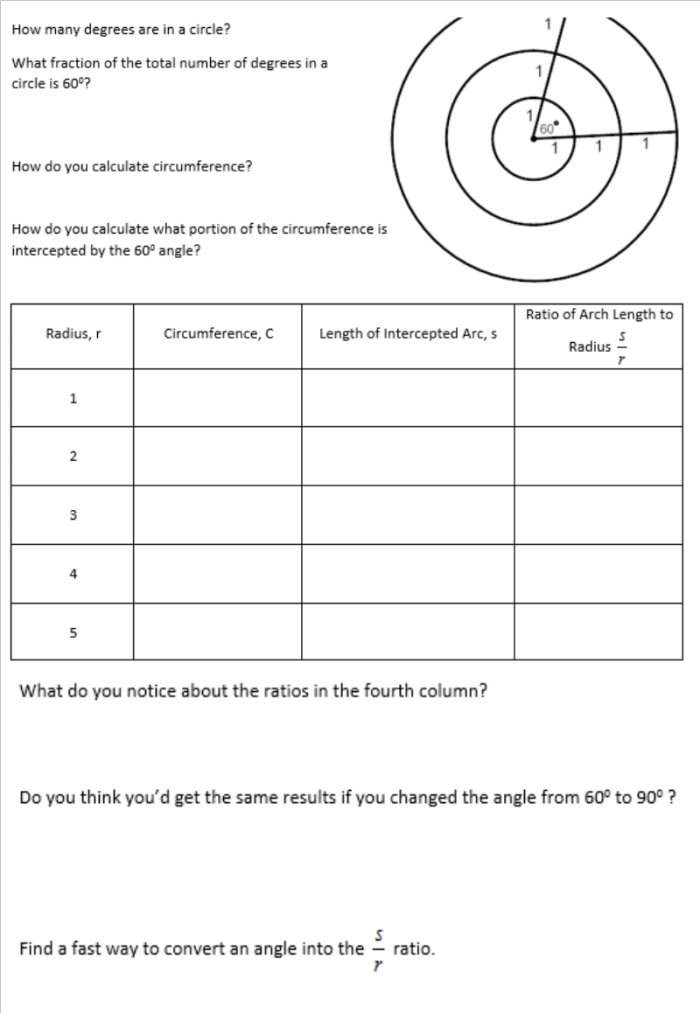
My hope today was that they would figure out the conversion to go from degrees to radians.  I found an intriguing activity in the textbook we currently use.  I modified to fit my style, but it has the same bones:

1.1 Radians and Arc Length_2

I was thrilled with how quickly they found that the s/r ratio is constant (in this case pi/3).  We defined that ratio as the number of radians, and my students decided that ratio measured the angle.  pi/3 is equivalent to 60 degrees.  Then we derived how to convert from one measurement to the other.

Day 1: Variables, Solving Equations and DMS

This year I’ll be teaching AP Statistics, Algebra II Honors and Precalculus.  I want transparency and an open dialogue about how to transform my curriculum in these classes.  Two of the classes, I’ve taught for a few years.  One of the classes is brand new to me.  I won’t tip you off to which is which, but feel free to comment freely.

My hope is to post something about each class every day…so here we go…

AP Statistics:

Today’s focus was on types of variables.  Mainly the difference between quantitative and categorical variables.

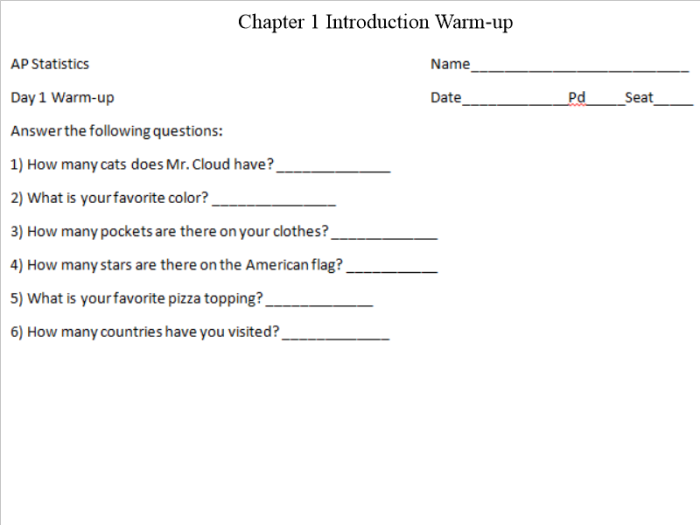
We started with this warm up:

Chapter 1 Introduction_1

The hope was that they would talk to each other about the questions, and I was curious who would ask me about question #1 (I have three cats…just so you know).

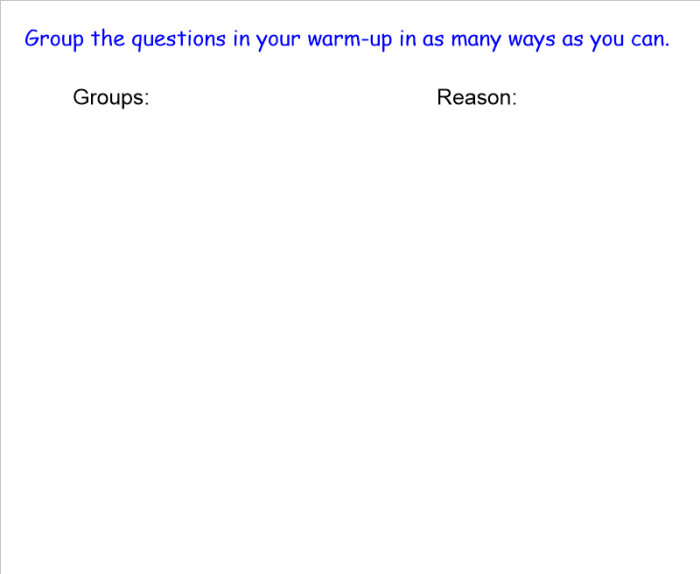
Without answering any of the questions, I showed this slide:

Chapter 1 Introduction_2

I loved that most of the students grouped the questions in two important ways. 1) They grouped the questions based on whether there was one distinct answer versus the answers having possible variability (which showed that they knew there was a difference with a statistical question versus a non-statistical question).  2) They grouped the questions based on whether the possible answers were numerical or non-numerical.

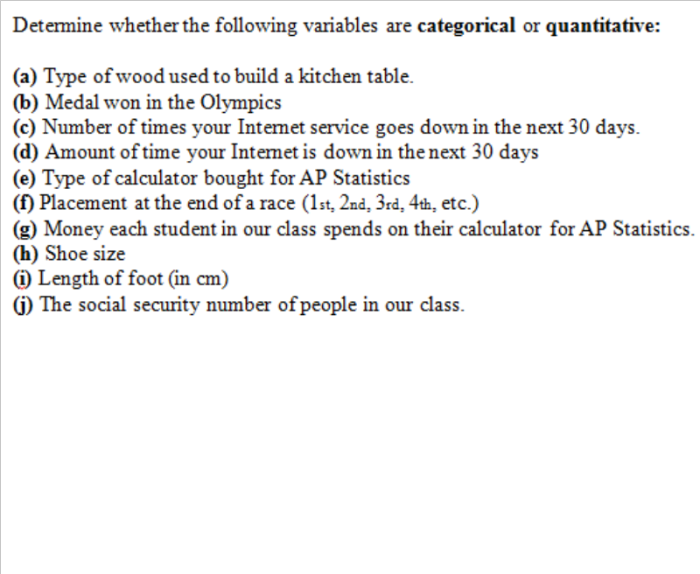
At this point they’ve stated that they know of quantitative versus categorical variables.  So, I wanted to dive into the grey areas and get a really good definition of quantitative and categorical.  I asked them to classify the following situations:

Chapter 1 Introduction_5

Through working on classifying these variables, my students came to some interesting conclusions.  First, they were able to better state that quantitative variables require measurement, not just a numerical response.  Second, and most interestingly, there was an in depth conversation (student started) that quantitative variables could be treated categorically; they concluded that someone has to be clear in stating their expectations for measurement.

Algebra II Honors:

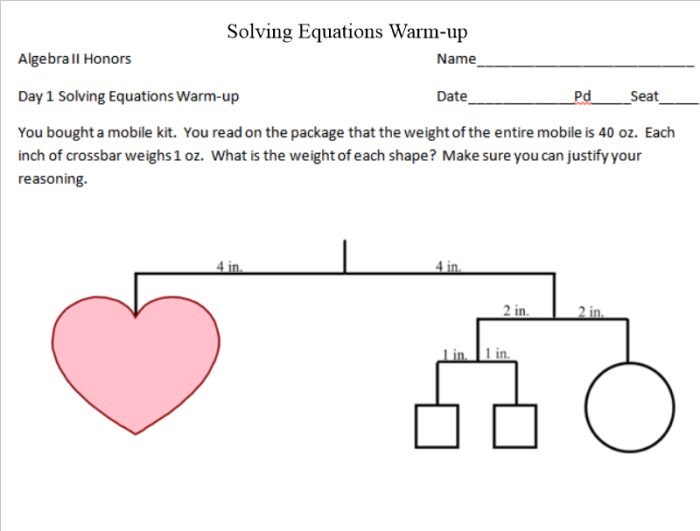
To ease into the new year, I wanted to make sure my algebra II students were able to solve one variable linear equations.  Sounds easy enough (and they thought it was too), but I wanted to give a different spin on it.

Unit 1 Intro (Solving Equations)_1

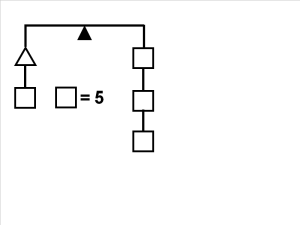
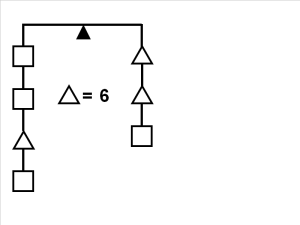
This question required that they keep everything in balance.  I wanted to encourage my students to work together and be self-sufficient in checking whether their solution is correct.  After having a consensus on a solution, they were asked to find the value of the missing shape in each of the following mobiles:

Unit 1 Intro (Solving Equations)_2 Unit 1 Intro (Solving Equations)_3

The first one was to build confidence; no problems…the triangle is worth 10.  In the second one, there were a bunch of methods used.  Some guessed and checked.  Others set up an equation.  A few noticed that a triangle and square cancelled each other out on the two sides and they were really solving 2 squares equals 1 triangle…which someone quickly noticed that they did the exact same thing if they set up an equation.  Amazing conversations.  Then we solved some equations.

Precalculus:

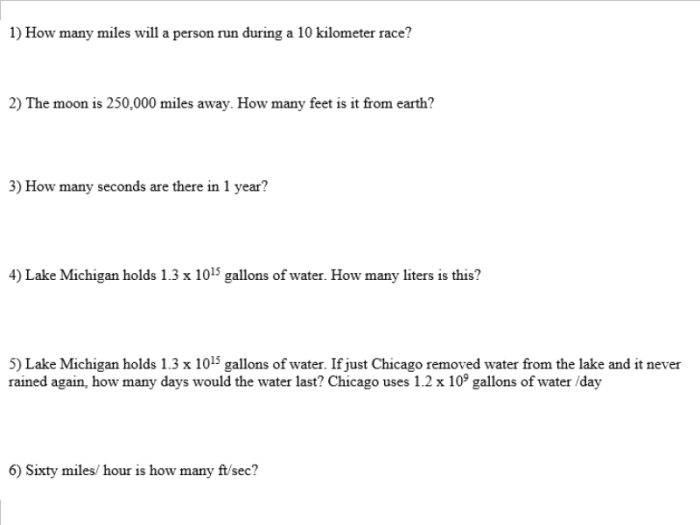
We started the period with practice using dimensional analysis to convert value.

1.1 Measuring in Degrees_1

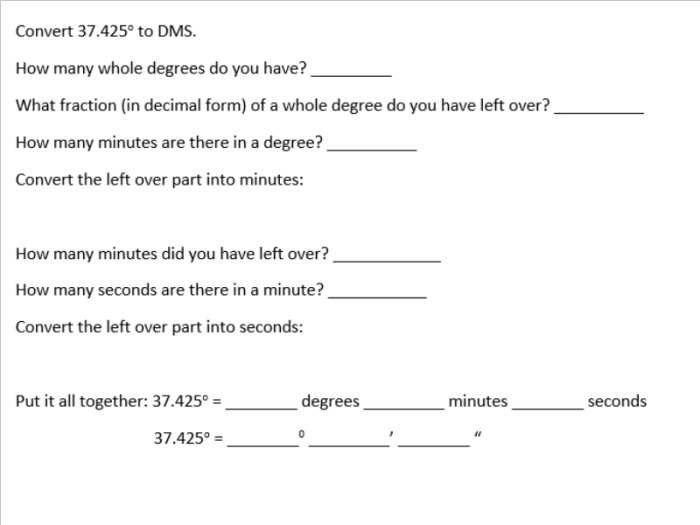
The purpose of this was to put a seed in their mind for figuring out how to convert angle measurements from degrees into degree-minutes-seconds form.  After defining how many minutes are in a degree (60) and how many seconds are in a minute (60) (then explaining how the Sumerians worked in a base 60 number system…which is why we measure time the way we do), I had them complete the following conversion:

1.1 Measuring in Degrees_5

I question whether I made this too leading, but everyone came up with a method that worked for them.  I challenged them for homework to come up with a method to convert an angle measured in DMS back to degrees.  We’ll see how they did tomorrow.


Algebra II Honors: Introducing Function Composition

In Algebra II, our second semester begins with function operations and inverses.  Since function composition is a very commonly used concept outside of the math classroom, I wanted to introduce the idea within a context.

So I opened the lesson with this picture:

6.2 Function Composition_4

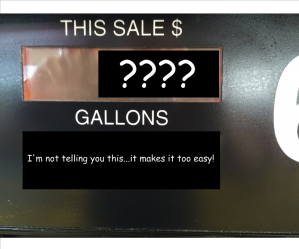
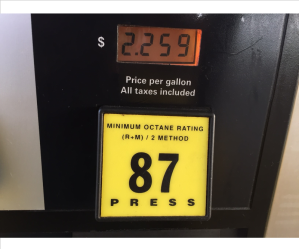
The goal for my students was to determine how much I paid for gas the day before.  I gave them some information:

6.2 Function Composition_6

My students wanted to know how much gas was and then proceeded to spend 45 seconds commenting on how inexpensive gas is at the moment (I figured this would happen given that my a lot of my students are starting to drive).

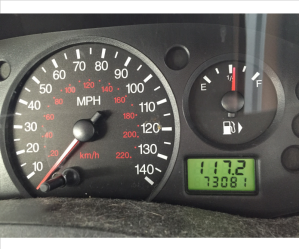
Then I told them how many miles I had driven:

6.2 Function Composition_5

Now that they knew the price and the fact I had driven 117.2 miles, I wanted them to make a prediction.

I got anything from a $15 prediction to a $40 prediction.  I was surprised to see that when I probed them about why they predicted the price that they did, quite a few of my students used the fact that I was filling up about a half tank of gas.  Questions and comments started flying about how many gallons of gas my car’s tank would hold.  I didn’t have an answer for them, and I tried to question how that would be a useful piece of information.  They said that if they knew how many gallons the tank was in total, they could figure out how many gallons half a tank is and use that to determine how much I paid.

A conversation about how they didn’t know exactly what proportion of my gas tank was being filled.  They weren’t happy…they said it was about half of a tank…I said that using the word “about” makes that information unusable…one or two students still weren’t happy.

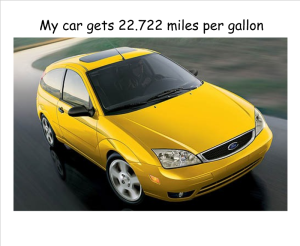
However, we did come to the conclusion that it would be nice to know how many gallons of gas my car needed…and I could help them with that:

6.2 Function Composition_7

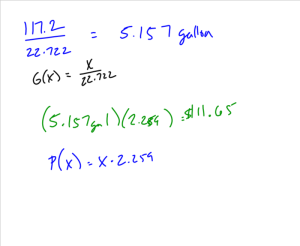
Then, I sent them off in their groups to determine how much I paid.  Five minutes later, I saw a lot of work that looked like this:

6.2 Function Composition_9

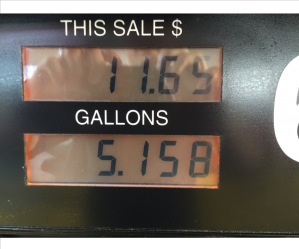
This was typical of the work I saw from my students.  There were a lot of good conversations about keeping track of units and how the process worked.  After discussing with students the answer:

6.2 Function Composition_8

We had a conversation about what the process entailed.  They decided that they took a mileage and turned it into a number of gallons, then took those gallons and turned it into a price.  I then defined this as a composition of functions.  Then we decontextualized and practiced.

AP Statistics: The Law of Large Numbers

I’ve been trying to come up with a way to immerse my students in the law of large numbers without simply giving them the law and reading example after example.  To jog your memory, the law of large numbers states: as the sample size increases, the experimental probability will approach the theoretical probability…or as one of my students stated, as the sample size gets larger, the prediction (experimental probability) gets more accurate.
6.3  Laws of Large and Small Numbers_1
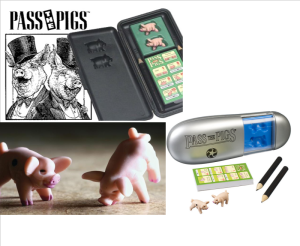
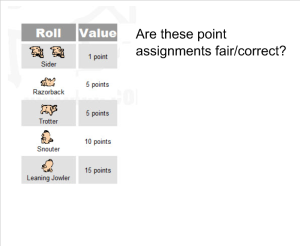
I’ve been playing Pass the Pigs for a long time, and I’ve always wondered about the probability of having the pigs land in the different piggy positions. (If you don’t know what I’m talking about, go here: http://passpigs.tripod.com/rules.html).
So, I asked them this question:
6.3  Laws of Large and Small Numbers_2
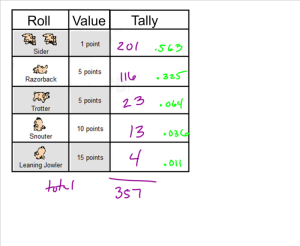
I explained to my students that we were going to modify the game to just look at rolling one pig.  The conversation started with my students deciding that the higher the point value, the harder that type of roll is to get.  someone eventually made the connection that the difficulty of the roll is inversely related to its probability.  I then asked them what the probabilities for the different rolls were.  They didn’t know,but were willing to roll some pigs to make some predictions . After some rolls, we gathered the class’s data and calculated experimental probabilities:
6.3  Laws of Large and Small Numbers_3
Tons of great conversation followed.  They argued about fairness and attempted to come up with a point system that was “fair.” After a few minutes, I brought them back to see what they were doing.  I pointed out that they were using those experimental probabilities as if they were the absolute truth.  A student quickly quipped: “but we did a lot of rolls, it should be pretty accurate.”
Then, and only then, we discussed the law of large numbers.

AP Statistics: How Many Penguins?

A little while ago, we began a unit on sampling and experimental design.  In the recent past, I have not done the shift from descriptive to inferential statistics any sort of justice.  Before exploring any sort of formal sampling methods, I wanted to have my students experience the idea of using a set of data to estimate a parameter.

I started the lesson with an example of this process that they’re familiar with:

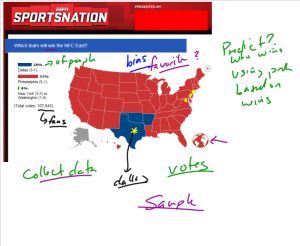
5.1 Samples and Populations_1

My students were given a screenshot of this ESPN poll and I asked them to tell me anything they could about it (as well as ask any questions they wanted).  With a bit of probing, my students were able to map out the process/purpose of this poll:  ESPN wants to take a small group of fans’ opinion on who will win the NFC East and use that to generalize to the population (of which we never came to a consensus about).

Next, I wanted to put them in a situation where the process they described could be used.  I remembered that I had seen an interesting question while working with FCR-STEM facilitating a summer statistics workshop:

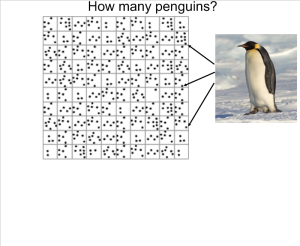
5.1 Samples and Populations_5

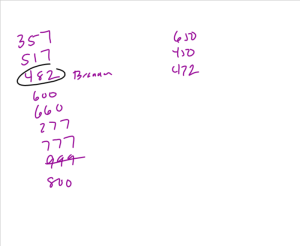
The premise is that this is an overhead shot of a section of Antarctica and each dot represents a penguin.  My students’ goal was to estimate the number of penguins.  First, I did a cheap method of getting some engagement…I had them guess how many penguins there are:

5.1 Samples and Populations_6

Then began the process of how to use the information we had quickly and efficiently. We discussed that, while it is possible to count every penguin, it was inefficient and really darn annoying to do so.  We devised a plan (or at least the class did): everybody chooses a square on the grid, we average those number of penguins and then multiply by 100.  Personally, I thought it was a good plan.

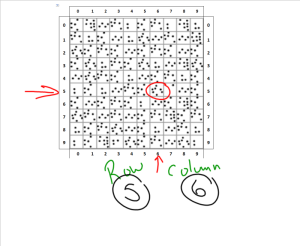
This is where the new material began for this unit.  We needed to discuss how each person would select their square.  A discussion of randomness and sampling ensued.  We decided that the calculator could be used for random digit generation and we could select rows and columns randomly:

5.1 Samples and Populations_7

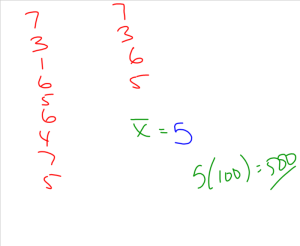
Then, each student selected their square and converted that to a number of penguins:

5.1 Samples and Populations_8

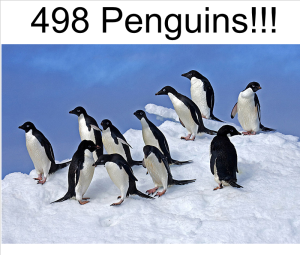
We came up with a class estimate of 500 penguins.  As it turns out, that was a pretty good estimate:

5.1 Samples and Populations_9

The next few lessons are about designing proper samples of all types, and what makes a bad sample bad.  Overall, I believe my students have a direction for the next few months thanks to this lesson.  The only change I will make in the future would be to take away the grid from the first picture I should them about the penguins.  I feel like I led them too much.  I want them to come up with that idea themselves.