A little while ago, we began a unit on sampling and experimental design. In the recent past, I have not done the shift from descriptive to inferential statistics any sort of justice. Before exploring any sort of formal sampling methods, I wanted to have my students experience the idea of using a set of data to estimate a parameter.
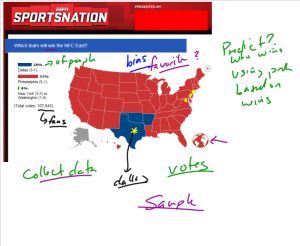
I started the lesson with an example of this process that they’re familiar with:
My students were given a screenshot of this ESPN poll and I asked them to tell me anything they could about it (as well as ask any questions they wanted). With a bit of probing, my students were able to map out the process/purpose of this poll: ESPN wants to take a small group of fans’ opinion on who will win the NFC East and use that to generalize to the population (of which we never came to a consensus about).
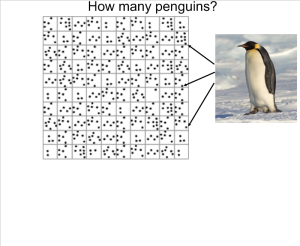
Next, I wanted to put them in a situation where the process they described could be used. I remembered that I had seen an interesting question while working with FCR-STEM facilitating a summer statistics workshop:
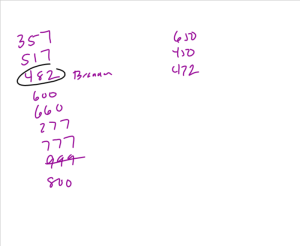
The premise is that this is an overhead shot of a section of Antarctica and each dot represents a penguin. My students’ goal was to estimate the number of penguins. First, I did a cheap method of getting some engagement…I had them guess how many penguins there are:
Then began the process of how to use the information we had quickly and efficiently. We discussed that, while it is possible to count every penguin, it was inefficient and really darn annoying to do so. We devised a plan (or at least the class did): everybody chooses a square on the grid, we average those number of penguins and then multiply by 100. Personally, I thought it was a good plan.
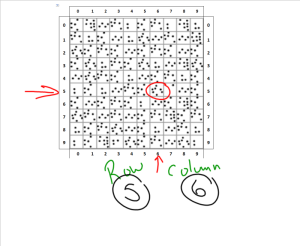
This is where the new material began for this unit. We needed to discuss how each person would select their square. A discussion of randomness and sampling ensued. We decided that the calculator could be used for random digit generation and we could select rows and columns randomly:
Then, each student selected their square and converted that to a number of penguins:
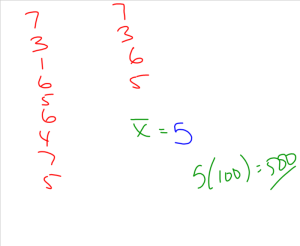
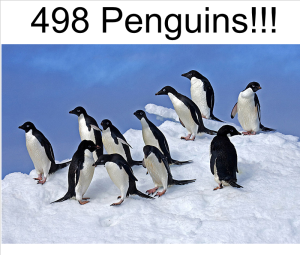
We came up with a class estimate of 500 penguins. As it turns out, that was a pretty good estimate:
The next few lessons are about designing proper samples of all types, and what makes a bad sample bad. Overall, I believe my students have a direction for the next few months thanks to this lesson. The only change I will make in the future would be to take away the grid from the first picture I should them about the penguins. I feel like I led them too much. I want them to come up with that idea themselves.
