Rumors and The Pentagon

Two short problems from class today:

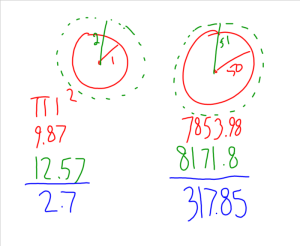
First, in Algebra II, we started discussing logarithms. Rather than just jumping straight into the definition, I gave my students an example (with a lot of pitfalls) that made a logarithm a necessary tool to use. Here is the situation:

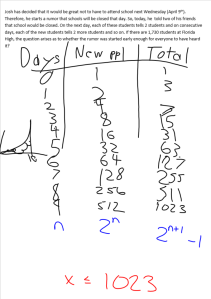
Josh has decided that it would be great not to have to attend school next Wednesday (April 9th). Therefore, he starts a rumor that schools will be closed that day. So, today, he told two of his friends that school would be closed. On the next day, each of these students tells 2 students and on consecutive days, each of the new students tells 2 more students and so on. If there are 1,730 students at Florida High, was started early enough for everyone to have heard it?

A lot of interesting conversation ensued. After a few minutes working with the problem, my students ended up at the following consensus:

6.2 Introduction to Logarithms_1

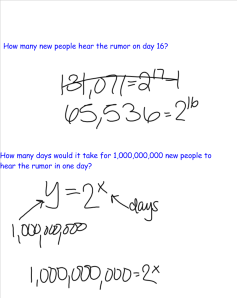
They decided that, at most (which took them a while to realize that some students may tell the same friends), 1023 students would hear the rumor, which is not enough. One student pointed out that if Josh had started the rumor one day sooner, everyone would have found at (at least by the numbers). There was great conversation about the pattern for the number of new people that heard the rumor and the pattern for the total number of people that heard the rumor were exponential. Some formulas were derived. Then this happened:

6.2 Introduction to Logarithms_2

The first question turned into a simple plug and chug in the formula issue. The second question led to some good discussion. My students decided that they needed something new…something they didn’t have…something that would allow them to find a missing exponent…a logarithm!!

Secondly, in geometry, we derived the formula for the area of a regular polygon. The interesting conversation came from an application problem.

Area of a Regular Polygon Lesson_8

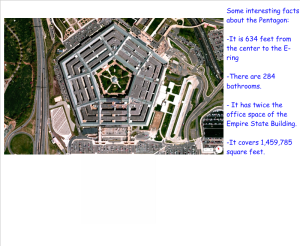
I gave them some interesting information about The Pentagon. I gave them the area of the building and the apothem (without telling them that’s what they had) and asked them for the perimeter.

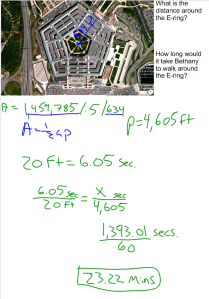
Area of a Regular Polygon Lesson_9

I know, it’s a really straight forward textbook style of question. I was excited, however, to see how interested some of my typically unengaged students were with this question. The really exciting part was when I asked them how long it would take Bethany to walk the perimeter of the E-ring. There wasn’t guessing, there wasn’t assuming…they went straight to: get her up in the front of the room and let’s do some measuring. They decided to use proportions and they decided that they needed to convert their answer to minutes. It’s really wonderful to see how they’re taking ownership in the problems and are driving the conversations. I did very little probing. I was truly facilitating and only offering suggestions. I can’t wait until this model can be fully implemented!

**Notes: I didn’t think up either situation. I found the rumor problem in a textbook and the pentagon idea in another blog. I just took them and made them fit my classroom.**
Two Area Problems

Geometric solids week is coming! Prior to starting a unit on surface area and volume, I wanted to spend a couple days working on their concept of area. I pillaged a couple of text books for some ideas.

Problem One:
Introduction to Area Meaning Field Dimensions Lesson_1

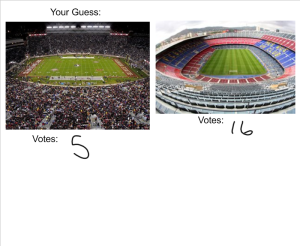
We ended up having a great conversation about the best way to answer the question. They immediately wanted to tell me what they knew. I showed them the results from the poll here on my blog (thanks to all of you who voted), and asked them to vote themselves:

Introduction to Area Meaning Field Dimensions Lesson_2

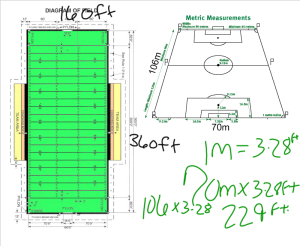
Then I asked them to justify their votes. Some students started to go into defining what larger meant (a really important idea). They wanted to give me that they “knew” that the soccer field is larger, but did not have a mathematical justification. Finally they asked for some measurements:

Introduction to Area Meaning Field Dimensions Lesson_3

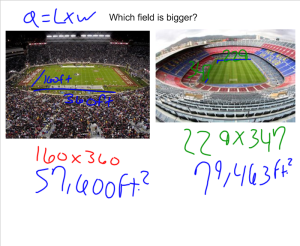
Some calculations ensued:

Introduction to Area Meaning Field Dimensions Lesson_4

They eventually decided the area of the soccer field was larger. A student made a great point that the football field is longer and that we had to make sure we were clear about how we defined “larger.”

Problem Two:
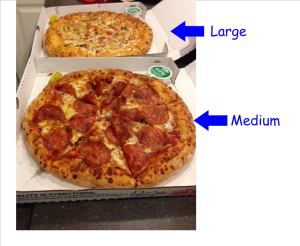
Which Pizza Deal is Better_1

These deals were taken straight from Papa John’s website. They immediately wanted measurements.

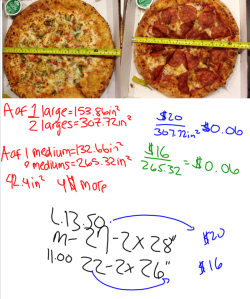
Which Pizza Deal is Better_2

Which Pizza Deal is Better_4

I wanted my students to explore which deal was better, and sent this problem home with them to work on. The work you see on the slide did not come easily. They came back with thoughts that I wasn’t expecting. I felt like this question was tailor made for area, yet a few of my students didn’t go there at all. They wanted to make the argument that they get “more inches of pizza” with the larger pizza deal, so it was worth it. We took some time to explore if an extra inch of pizza is the same whether you start with a one inch pizza or a fifty inch pizza:

Which Pizza Deal is Better_6

They decided that that an extra inch isn’t always the same in a circle. Eventually, with more probing than I expected, we got to the idea of a unit rate. I know they’ve seen unit rates and they’ve seen area, but I don’t know that they’d seen them together before. To everyone’s surprise (including mine) the unit rates for both deals works out to cost about $0.06 per square inch of pizza. Therefore, there isn’t a better deal…only how much pizza you actually want!

Mr. Cloud Needs Your Help!

I am planning a lesson in which my students have to figure out which is bigger:

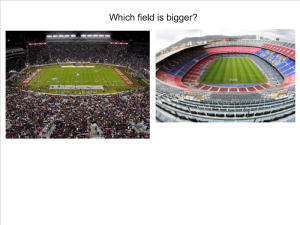
FC Barcelona’s soccer field or Florida State’s football field

Here’s the slide my students will see:

Introduction to Area Meaning Field Dimensions Lesson_1

There will be a twist, but I’ll give details about that after the lesson. What I need you to do is answer the poll below about which you think is bigger. This is just gut reaction…no research. Leave comments if you feel like you need to justify your choice. All data collected and comments left will be discussed on Tuesday in class.

How Much is This Cheeseburger?

We have reached spring break. This past Friday, we had our school’s spring carnival. This meant that teachers lost a day with 6th and 7th periods. My Algebra II classes are 4th and 7th period; so I didn’t have class with 7th period on Friday. Since we had just tested the day before in 4th period, I decided Friday was a perfect day to experiment.

The first day of class in my classroom changes each year. I always start the year placing my students in a mathematical situation. While it may not be directly from the curriculum, I feel that my students can get the best idea what my class is about by doing math…as weird as that sounds. Placing them in the thick of a math problem and see how they respond gives me a lot of information about my students. Likewise, being in the thick of a math problem can tell my students a lot about what I expect of them.

My 4th period class likes to be a challenge. They don’t like math/ think math is hard/ just want me to tell them what to do so they can move on with their lives/ are tired of the school year and are looking forward to summer (and probably summer 2015 for a bunch of them). This mindset is perfect for my experiment.

So here’s the experiment:

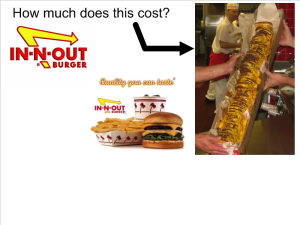
In and Out Burger Lesson_1

What a simple question. How much was that cheeseburger. There tended to be two common responses: “ewww” and “I want one.” Then the guesses started flying. Some were reasonable, some definitely weren’t. I didn’t care about the unreasonable guesses; at least they were engaged in the question and were taking some ownership in the problem. Finally some questions were asked. The most important questions got me to tell them that on this burger there was one bun, one hundred patties, and one hundred slices of cheese. Now the question is accessible. “Give us some prices Mr. Cloud.”

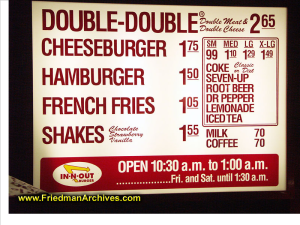
So I did:

In and Out Burger Lesson_2

That’s all they get. That’s all the menu at the restaurant has. There weren’t any complaints. Nobody said this is stupid. They went right to work trying to figure it out. There were wonderfully insightful conversations/questions. “A cheeseburger has one bun, one patty and one piece of cheese. You can’t just multiply by 100. You’ll have 100 buns.” It was a magical 15 minutes. I didn’t have to lead or quiz or scold or encourage. They were doing it; they were doing math. They were discussing and justifying. Groups started collaborating with other groups. They were getting the same answer. Groups that didn’t get it asked for explanations from other groups. All of this from a group of students who couldn’t care less (at times) how the fundamental theorem of algebra relates to the real and imaginary roots of a quintic polynomial. This lesson worked and will work as a way to create a setting for next year’s classes. Now just to figure out how to do this every day. This 15 minutes is how I picture my classroom all 50 minutes all 180 days.

Oh here’s the answer by the way:

In and Out Burger Lesson_3

Somewhere in the neighborhood of 95% of my students got to the answer. They used systems of equations and didn’t even know it!

Two Quickies From Today

Two quick hits from classes today:

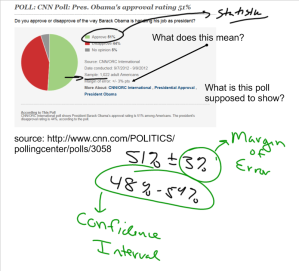
In statistics, we have just ventured into inference and building confidence intervals. I wanted to give my students the opportunity to ground their understanding into something familiar. I did some quick research and found a poll that CNN conducted in 2012:
10.1 More on Confidence Intervals_1

A lot of students indicated that they’re familiar with this kind of polling and have seen a margin of error. Because this poll was used as a warm up (I asked them to decode what CNN had posted), the conversation in class went in the opposite order than usual. In the past, we would calculate the confidence interval and decipher what it meant. This year, my students took more ownership in the confidence interval. Questions like “Where did the margin of error come from?” and “How do we determine what z-score to use?” drove the conversation today.

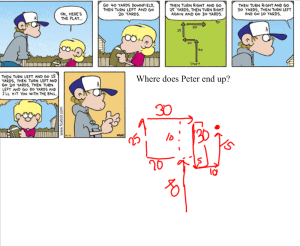
In geometry, we began our study of vectors as an application of the trigonometry we studied. Most of my students have little or absolutely no experience with vectors. Step one was to define what a vector is and when they’re useful. I decided a Foxtrot comic was the way to go:

7.4 Vectors Part 1 Lesson_2

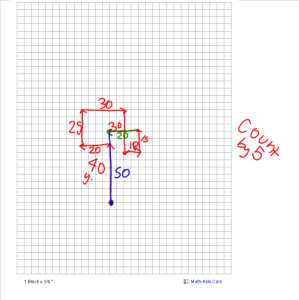
The class quickly decided that their way of approaching the problem wasn’t working. They decided to ask for a grid:

7.4 Vectors Part 1 Lesson_3

They decided that these arrows they were drawing had two parts: a direction and a length. Little did my students know, they just figured out a definition and a use for vectors.

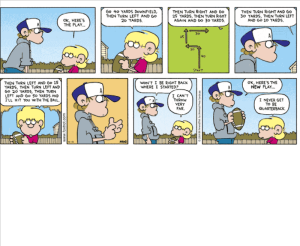
Here’s the whole comic:

7.4 Vectors Part 1 Lesson_4
FOXTROT (c) Bill Amend. Reprinted with permission of UNIVERSAL UCLICK. All rights reserved.

I did ask permission to use the comic and have been asked to add the line above.

Mr. Cloud’s Foul Shots

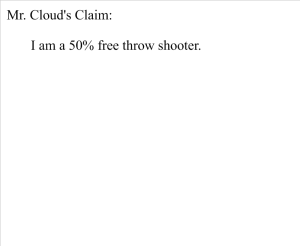
We are getting dangerously close to dealing with inference in statistics. We have been working for a while on sampling distributions for means and proportions and calculating probabilities for them. I wanted to give my students an opportunity to apply their probability calculations for a purpose other than answering a question on a handout, so I gave them this:

Mr. Cloud's Free Throws Lesson_1

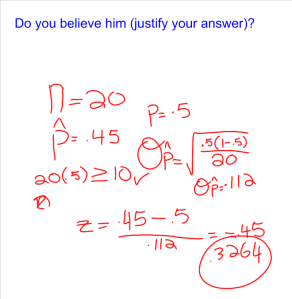
Any athlete in the class immediately said “no way.” I asked them to defend their argument and someone asked me to prove it. We talked and they got to the conclusion that I couldn’t prove it, but they could disprove my claim. They wanted to see me shoot some foul shots:

This confounded them a bit. I only made 45% of my free throws. They couldn’t tell whether that was different enough from 50% to say my claim was wrong. Someone finally asked for a probability to quantify their feelings:

Mr. Cloud's Free Throws Lesson_2

There’s a 32% chance that I could be a 50% free throw shooter and make 9 or less out of 20. They concluded that probablity was too high and they couldn’t disprove my claim.

Hopefully this groundwork will pay off when we officially start inference on friday.

Mr. Cloud’s Trip

After years of using a trip directions metaphor to describe what an inverse function is, I decided to develop this year’s lesson around that metaphor. I started the lesson with a review of function operations and composition on a series of tables, but curiously put a question on there with some notation that didn’t look familiar. The question was an inverse function question. After showing the class the answer, they decided they needed more information about how to “do the problem.” You know that’s not good enough. They know that’s not good enough. Yet, they still asked. And here’s how the lesson on inverses progressed…

I opened with this homemade video:

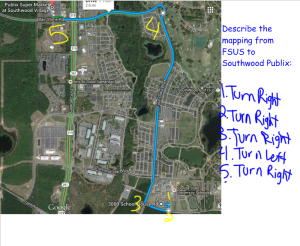
Then, a student gave directions on how I went from school to Publix:

5.7 Function Inverses Introduction (Mapping to Publix)_1

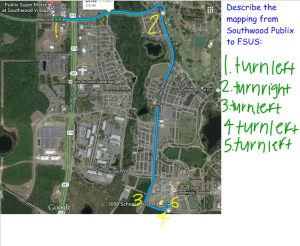
Thus began our discussion of a function inverse. I asked another student to get us back from Publix to school (following the same route):

5.7 Function Inverses Introduction (Mapping to Publix)_2

This is where we defined a function inverse. If a function maps you from an input to an output, its inverse maps you from the output back to the input. That’s a one-line interpretation of the conversation; a lot more went into it. But you get the gist.

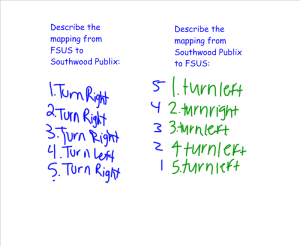
The next step was to figure out how to calculate the inverse function. The first thought a few students had was to just turn left where we turned right and turn right where we turned left. So we compared:

5.7 Function Inverses Introduction (Mapping to Publix)_3

The class decided that we had to do the opposite operation (turn) but it had to be done in the opposite order. The last turn into Publix is the first turn you undo when leaving Publix.

The rest of the lesson was rather pedestrian with some examples and practice. I’m hoping that this understanding of the meaning of an inverse of a function pays off.

Who is at Fault for This Car Accident?

**Disclaimer** Some of the images in this lesson are not of my own creation. I have borrowed them from Dan Meyer’s blog…although I am repurposing them.

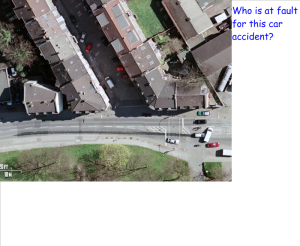
The lesson began with this slide:

5.3 Intro to Radical Graphs Car Accident Problem_1 - Copy

We had a conversation about what we see. My students had to decide what’s important about the car accident and what’s not important about the car accident. Ultimately, the students boiled the question down to whether the van pulled out in front of the car and whether the car was going too fast to stop (just look at those skid marks!).

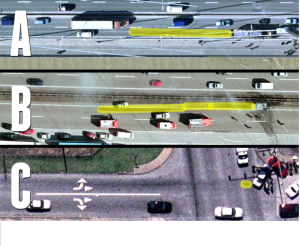
I asked my students how fast they think the car was going, and they give their guesses. To give my students some extra information, I give my students the following slide:

5.3 Intro to Radical Graphs Car Accident Problem_2 - Copy

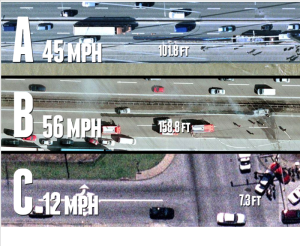
My students decided some numbers would be nice:

5.3 Intro to Radical Graphs Car Accident Problem_3 - Copy

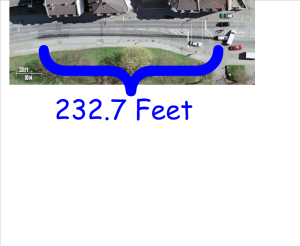
Then they wanted this information:

5.3 Intro to Radical Graphs Car Accident Problem_5 - Copy

A very insightful student asked a great question at this point: “Can we just use a proportion to figure out how fast the car was going?”

Another insightful student commented “We can do that if the relationship is linear.”

Needless to say, I was really excited about where the conversation was going.

I asked how could we tell if the relationship is linear. Crickets. I showed them the data again. Someone finally mentioned a graph (imagine…a place where a graph would be useful), so geogebra created us a scatterplot.

skid mark scatterplot

Someone yelled “that’s not linear!” I emphasized their point:

skid mark scatterplot linear

My students noticed that there were a lot of options in the dropdown menu for types of relationships and, after a few clicks, they settled on this graph:

skid mark scatterplot square root

As it turned out, the relationship was radical. My students used the equation to estimate a speed in the neighborhood of 70mph and decided that the car was going too fast.

Note: I guess I should note that the goal of this lesson was to graph square root and cube root functions. In all, this opener took about 15 minutes of class time. I feel they were 15 minutes well spent. Now there’s a context to when these graphs may be useful.

Note: I had to set the data up and ask the question that forced the input of the function to the be the length of the skid mark and the output to be the speed…otherwise, this doesn’t work.